

Tracking the proper metrics is essential in understanding how your business is performing. Having proper data, reports and a recurring cadence for analyzing these reports is necessary if you want to make data driven and meaningful decisions.
There is a long list of metrics for each pillar of Customer Success but for the purposes of this post I’ll focus on the key metrics for Customer Success Management and the metrics commonly used for CS as a whole (I’ll save customer support and customer education metrics for another post).
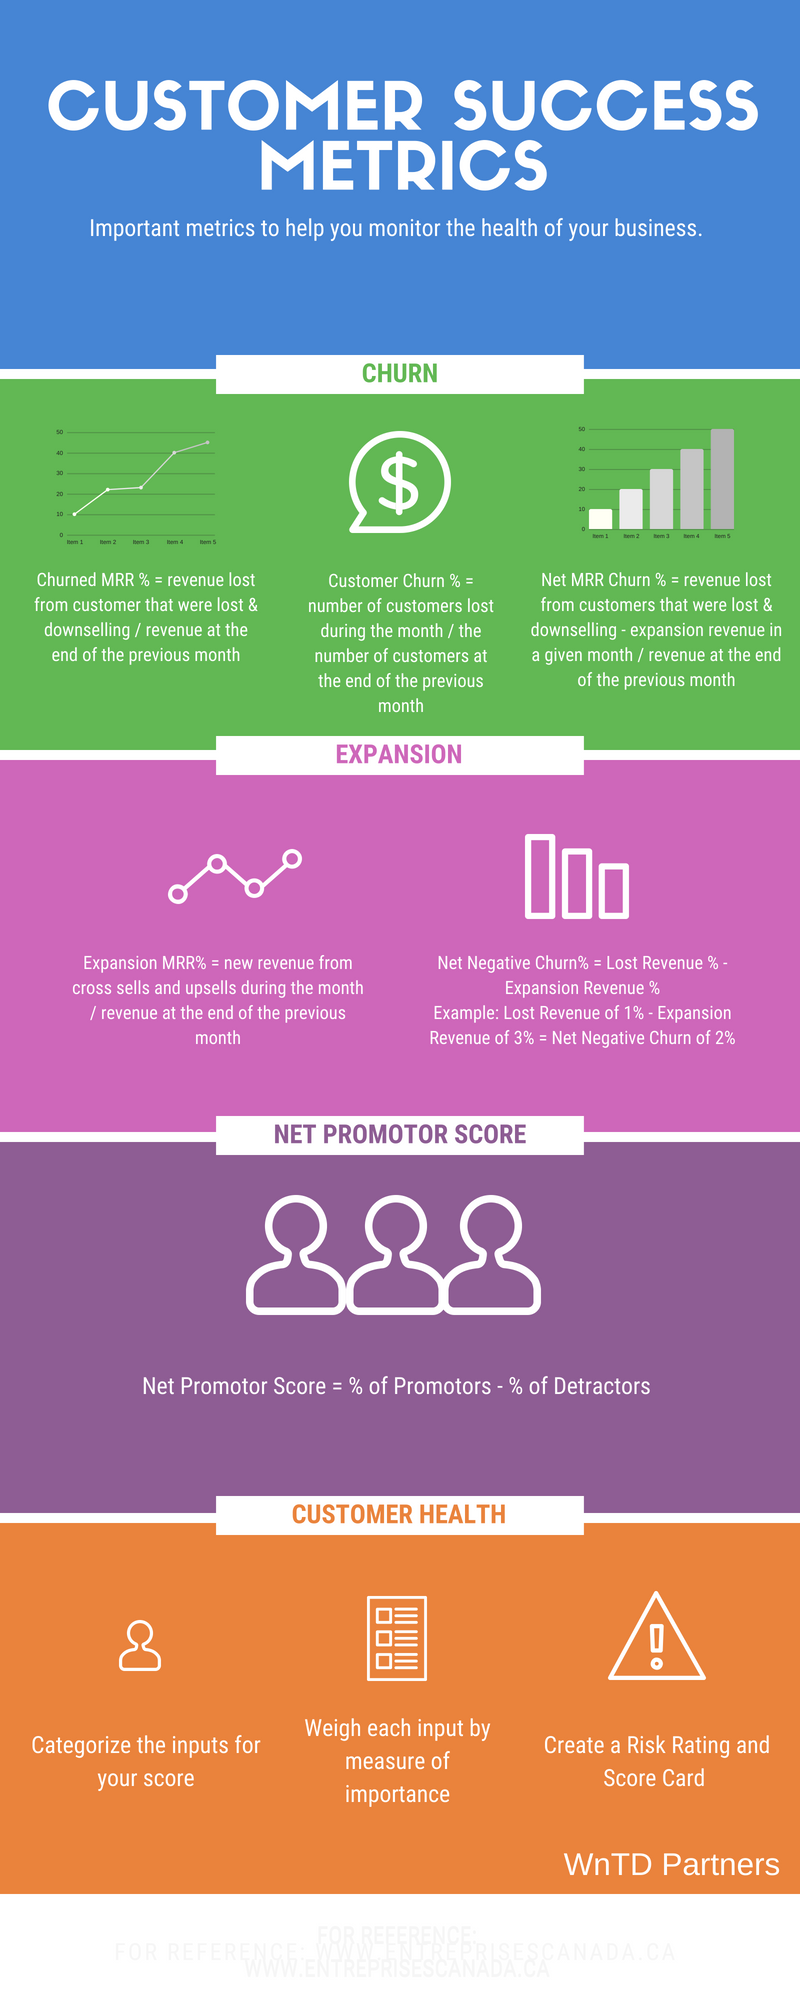
For now let’s concentrate on the following four main metrics.
- Churn
- Expansion
- Net Promoter Score (NPS)
- Customer Health
Churn
Simply put, churn are the customers that you lose. Churn can have a massive impact on your business, both positively and negatively. On the negative side, if you have a high level of churn it can mean you are bleeding customers faster than you are gaining them. The result could be that you will run out of money if you don’t turn this trend around, even if your sales are showing a the so called hockey stick trajectory. On the positive side, if you have negative churn, meaning that your customers are growing in revenue at a higher rate than you are losing them, it means your customers are not only staying but spending more with you.
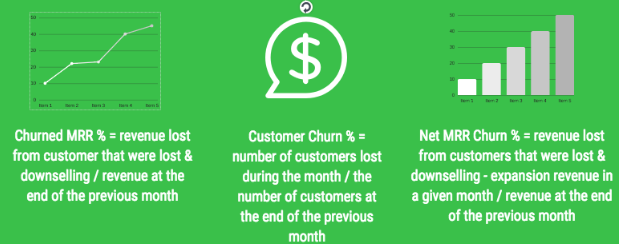
There are a number of ways to measure churn:
- MRR & ARR by dollar amount
- MRR & ARR by Percentage
- Customers by Volume
- Customers by Percentage
- Net MRR Churn
Churn can be calculated in the following ways:
Which churn numbers you track can depend on your business. If you have a high volume of customers that are on monthly contracts then you will want to watch volume of customer churn and revenue churn. However, if you have fewer customers who are only on annual contracts and who you upsell and cross-sell to, you would want to keep a closer eye on Net Revenue Churn.
You may be asking at this point what is considered low churn and what is high churn. This really depends on your industry so you want to familiarize yourself with industry benchmarks. It is also worth engaging an independent unbiased third party to do a Voice of the Customer project and analysis. It typically involves interviewing customers and looking at your NPS scores and strategy.
Expansion
Expansion revenue can have a big impact on your SaaS metrics and your bottom line. According to a Bain & Co Study boosting retention rates by 5% can increase profits by 25 to 95%. This is not just because of revenue from renewals but it’s also because the odds of converting current customers via cross-sells and up-sells has a 60 to 70% probability whereas a new sale has only a 5 to 20% chance of converting.
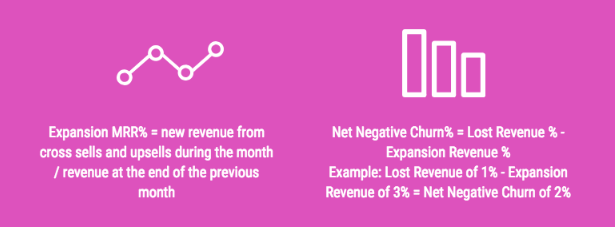
Hopefully this is enough to convince you that expansion is worthy of your time and attention. To track expansion you can use this straight forward formula:
You’ll want to measure your expansion revenue from your cross-selling and up-selling month over month and ensure your capturing additional revenue from your existing base. If you aren’t, create a strategy and tactical plan to achieve this.
The ultimate goal is to get to net negative churn, which is when your expansion revenue is greater than your churned revenue. The value this adds to your company is tremendous. According to the Bain & Co data mentioned above, ‘a 10 percent rise in customer retention yields a 30 percent increase in the value of the company’.
For the record, this data on the value of customer retention and selling to your base is not new but introducing a strategy around retention and expansion with a customer success focus is new to many. In the grand scheme of things SaaS is still new to the business world and some organizations are learning how to adopt a customer success strategy that helps achieve strong churn and expansion results across their business. A word of caution though, don’t take your customer retention data and strategy for granted or leave it to chance. Many businesses have used the The Pareto Principle across their entire business, which when applied to a business states that 20% of your customers represent 80% of your sales. This is incredibly powerful and one of the biggest reasons you will want to track your expansion metrics for your company.
Net Promoter Score
Consider your NPS score your barometer of customer sentiment. If you have a low score it can create pressure internally to understand what is causing customers to be unhappy and become detractors. It’s also a leading indicator of churn so you’ll want to apply pressure in the appropriate areas of the business to understand the drivers of the low score and come up with a plan to course correct. Whereas if you have a high NPS score there is a little less urgency and less pressure to stop an impending spike in churn. It’s important to track NPS in either case, after all it’s also vital to know what customer segments are happy and what is driving these customers to be promoters. There is the old adage of if it’s not broken don’t fix it which usually rings true. Also, it’s important to understand the perceived value your customers are receiving from your business. For example, you may make the assumption that it’s driven completely by product features but then learn from NPS feedback that it’s the ease of use that customers love and the value they receive from your customer success team and educational content.
In order to determine your NPS score you need to survey your customers, with a survey that simply states:
How likely is it that you would recommend [insert your brand here] to a friend or colleague?
Your customers respond through a rating system of 0 to 10. Their response puts them into the following categories:
Detractors (0 – 6) – These are unhappy customers who are likely to not only churn but are also likely to give negative word of mouth, which will hurt your brand reputation and slow down your growth.
Passives (7 to 8) – These customers are not completely dissatisfied but could easily switch to a competitor and churn. While there are aspects of your product and service that they like, there are also things they are unhappy with so they could easily drop into the detractor bucket if ignored, or on the flip side, move up to the promotor group if nurtured and if issues are addressed.
Promoters (9 to 10) – These customers are happy with your product and services, will likely provide positive word of mouth, and potentially even referrals. They are low risk to churn and where you want the vast majority of your customers to be.
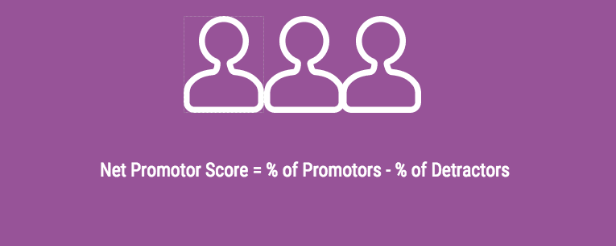
To calculate your overall NPS score use the following formula:
A best practice on NPS is to tag your responses by various customer types and categorize topics that they mention if they leave a comment. For example, if you have an enterprise customer that is considered an ideal fit customer you may want to tag them as ‘Tier 1’. If they mention that they are unhappy due to a bug that has not been resolved and impacting their ability to use your product you may want to tag the response with ‘bug’ and ‘usability’. If a customer that is a bad fit gives you a ‘0’ score you may want to tag them as ‘bad fit’ or ‘tier 3’.
The purpose of tagging customer segments is not a way of intending to game the NPS system and inflate your score, but you do want to be able to isolate groups of customers to understand a deeper layer of the data and the source of your detractors, passives and promotors. You also want to understand the reason for your customers scores, both good and bad, so you know what the drivers are and what areas to address, whether it be with your product, service, selling to the wrong customers or a combination of reasons.
Customer Health
The Customer Health score is exactly how it sounds – it’s a gauge of health for each customer. The first step is to determine the inputs that will make up your health score. Some examples are:
- Product Usage – this is the overall usage of your product
- Volume of Support Tickets
- Volume of Support Tickets that are unresolved
- NPS score
- CSAT Score (customer satisfaction)
- CES Score (customer effort score)
- Relationship Level – do you have an active relationship with the C-suite and decision makers
- Number of users
- Billing history
- Length of time as a customer
- Volume of up-sell or cross-sell (in other words, is the account growing, shrinking or staying the same)
- Are they are reference-able client
- Do they provide referrals
- Have they submitted product feedback
- Do people at the decision making level use your product
- Are they a a good or bad fit customer
This is by no means an exhaustive list but it is some of the common inputs of a health score.
Once you determine the inputs the next is deciding how to weight each input in your score. For example, product usage could have a 40% weighting of your health score whereas whether they have provided referrals or not could be a 5% to 10% weighting.
The next step is creating a score card for your data. It may look something like this when looking at the input of Product Usage:
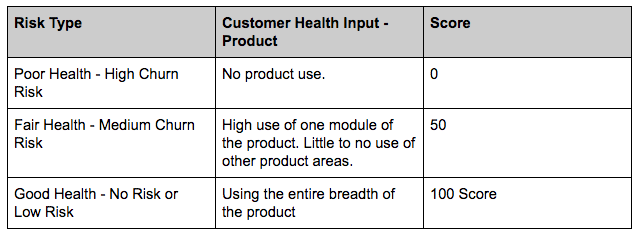
If product usage had a 40% weighting in your customer health score algorithm then in each of the risk type examples above you would get 0 points in the Poor Health category (0 x 40% = 0), 20 points in the Fair Health category (50 x 40% = 20) and 100 points in the Good Health category (100 x 40% = 40).
Here is a cheat sheet for you to reference in the future:

One of the points of value of having a Customer Health Score is that it helps to inform your Customer Success Managers on where they should be directing their time and energy. It is also an indicator to leadership of potential spikes in churn or expansion. It can help to inform better short-term and long-term decisions when you have a pulse on how your customer base is doing. It allows cross-functional teams to capitalize on opportunities, such as having marketing and customer success work together on expansion campaigns and also allows teams to mobilize resources to prevent churn if scores are low. For example, having product and customer success work together on solving the most pressing product issues.
Reporting
One last word on best practices around customer success metrics. Now that we dove into the specific metrics for customer success I want to briefly talk about some best practices your organization should adopt if you have not already done so.
Step One – Establish the exact reports that will be viewed on a monthly basis. Make sure you are comparing apples to apples and looking at the same reports month over month and quarter over quarter. This allows you to spot trends overtime as opposed to simply looking at a snapshot of one point in time.
Step Two – Make sure everyone is aligned on the metrics that matter most to your business. There are many metrics you can choose to track but not all of them will be as relevant for your business. This may seem obvious but if it’s not explicitly agreed to you may have some team members who monitor customer churn more closely and others who monitor percentage of revenue churn. This can lead to misunderstandings in conversations and presentations on critical data.
Step Three – Once you establish what your reports are you want to keep an eye out for the drivers of the results. For example, if you see a month over month increase in churn you will want to dig into what is causing it. Has something changed in the competitive landscape, or is there consistent negative feedback coming from customers, or did NPS nose dive over the periods leading to this spike in churn? Talk to your customer facing teams, look at support ticket data, customer satisfaction scores, customer effort scores and NPS results to determine what these drivers may be.
There’s a lot of data to track in today’s business world and some is more important the others. The metrics above are a good foundation for your Customer Success team. It’s not an exhaustive list but if you monitor these metrics it will serve as a signal to your organization of when things are going well with your customers and when there is cause for concern.
There’s a complete infographic on all the metrics discussed in this post below. It may be useful to bookmark or print it off until these metrics become second nature and part of your everyday language. If you’d like to discuss metrics for your specific business with us please get in touch.
Download the Customer Success Metrics infographic here.


